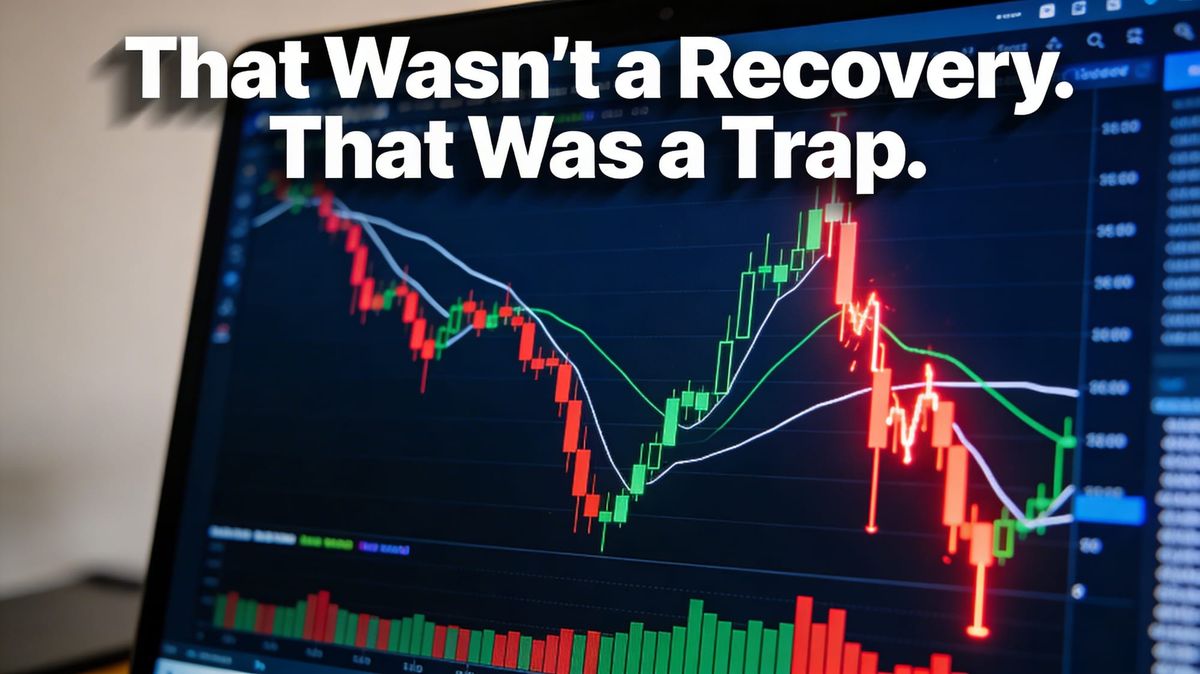
That Wasn't a Recovery. That Was a Trap.
How to tell the difference between a real bounce and a short squeeze — before it costs you.
You're watching a stock — or an index, or a futures contract — that's been falling for weeks. Then one day it just rips. Up 10%, 12%, sometimes more, in the span of a day or two. The headlines start calling it a "relief rally." Social media lights up. People who've been sitting on the sidelines start wondering if they missed the turn.
So they buy.
Then a week later, the thing is making new lows.
If that sequence sounds familiar, you've probably been on the wrong side of a short squeeze. And if it hasn't happened to you yet, it will — unless you know what to look for.
First, let's talk about short sellers
To understand a short squeeze, you first need to understand what a short seller is.
Most people invest the straightforward way: you buy something, you hope it goes up, you sell it later for a profit. A short seller does the opposite. They borrow shares of a stock, sell them immediately, and hope the price drops so they can buy them back cheaper and pocket the difference. It's a bet that something is going to fall.
Short sellers aren't villains — they're just people with a different opinion about where price is headed. And sometimes they're right. When a stock has been falling hard, it often means a meaningful number of short sellers have piled in, all betting the decline continues.
Here's where it gets interesting.
What actually happens during a squeeze
When a stock starts moving up — even for a completely unrelated reason, like a rumor, a news item, or just a slow day with light selling — short sellers start getting nervous. Their position is moving against them. If the stock keeps rising, their losses keep growing.
At some point, enough of them decide to cut their losses and get out. To close a short position, you have to buy the stock back. So suddenly you have a wave of short sellers all buying at the same time — not because they think the stock is a good investment, but because they're trying to stop the bleeding.
That buying pressure sends the price up further. Which makes more short sellers nervous. Which triggers more buying. The move feeds on itself — and from the outside, it looks exactly like genuine demand. It looks like the market has changed its mind. It looks like a recovery.
It isn't. It's a mechanical reaction. Forced buying, not conviction.
The other side of the same coin
Here's something worth noting: while the buyer is chasing the bounce thinking the bottom is in, the short seller who had the right thesis is often doing the opposite — panicking out of a correct position at exactly the wrong moment. They were right about the direction. They just got squeezed out before the move played out. Both people are reacting to the same price action. Both are letting the candle make the decision instead of the structure.
That's the trap from both sides.
How to tell the difference in real time
So how do you know if a move is real or a squeeze? You can't always know for certain, but there are three things worth checking before you act.
Before we get there, a quick note on how to read what you're looking at. When you pull up a stock chart, each day is usually represented as a small bar or block — called a candle — that shows you four things: where the price opened that morning, where it closed at the end of the day, and how high and how low it traveled in between. The colored body of the candle shows the open-to-close range. The thin lines extending above and below it — called wicks — show how far price reached during the day before pulling back. A long wick on top means price shot up but couldn't hold it. That detail matters more than most beginners realize.
Look at how the day actually closes. A genuine recovery tends to close strong — near the top of the day's range, with buyers in control into the close. A squeeze often shows what traders call a "wick" — the price shot up during the day but pulled back before the close, leaving a long shadow on the candle. That wick is the market telling you the buying didn't hold.
Watch whether the volume sustains. Squeeze moves often come on a burst of volume that fades quickly. If the big up day isn't followed by continued buying on subsequent days, the move is losing its fuel.
Check where the price stalled. Squeezes frequently run up into a level that previously acted as resistance — a price where sellers showed up before. If the stock rips 12% straight into a ceiling it already bounced off twice, that's not a breakout. That's a test.
In late March 2026, NQ futures staged a sharp two-day rally off the lows — the kind of move that looked, on the surface, like a trend change. But the daily closes were wicky, volume didn't follow through, and price stalled right inside a zone of prior resistance where sellers had already shown up once before. The structure never confirmed the move. At the time of writing, the rally has rolled over — but markets don't move in straight lines, and a news-heavy week can rewrite the picture quickly. Whether the broader trend resumes its descent, stabilizes, or pushes higher from here is still being decided in real time. That uncertainty is the point. The lesson isn't about the direction — it's about what the structure was communicating in the moment, and why reacting to a single day's price move before the close is almost always premature.
Why we fall for it
Because hope is a powerful thing. When you've been watching something fall and it finally moves in the right direction, every instinct says this is it. The brain wants the pain to be over. It wants the story to have a turning point.
The market doesn't care about your story. It doesn't know you need a recovery. It moves on supply, demand, and mechanics — and a short squeeze is mechanics, not momentum.
The one rule worth keeping
Don't trade the candle. Wait for the close.
A candle that's up 12% at 2pm means nothing on its own. What matters is where price settles at the end of the day — and whether the days that follow show continued buying or a quiet fade back toward the lows.
One strong close doesn't make a trend. But it's a start. Two or three, with volume, in the right direction, closing near the highs? That's worth paying attention to.
One violent up-day that gives most of it back by the bell? That's a squeeze. And the trap is already closing.
The Less Intimidating is a financial education blog built for people who are tired of being talked down to. Nothing here is financial advice. Everything here is an honest conversation.